How to Read Minified Code: A Developer's Survival Guide
Production emergencies never happen at convenient times. The phone rings at 2 AM—users can't complete purchases on your e-commerce site. You groggily fire up your browser, open developer tools, and stare at a wall of incomprehensible minified JavaScript. Single-character variable names. No line breaks. Functions crammed onto single lines. Everything you need to debug the issue is technically right there in front of you, but it might as well be written in ancient hieroglyphics. This scenario plays out thousands of times daily for developers worldwide. Learning to effectively read and debug minified code transforms from a nice-to-have skill into an absolutely essential survival technique.
Why You'll Need This Skill
Production code is almost always minified on modern websites. Performance optimization demands it—unminified JavaScript files are simply too large for acceptable page load times on mobile networks. Even if your own projects don't minify code (a significant mistake), you'll inevitably need to debug minified code from third-party libraries, CDN-hosted frameworks, or partners' integrations.
Third-party scripts come minified by default. Google Analytics, advertising scripts, payment processors, and countless other integrations serve minified JavaScript. When these scripts break or cause issues, you need to understand what they're doing despite the minification. You cannot simply avoid minified code—the modern web runs on it.
Source maps aren't always available. In an ideal world, every production site includes source maps letting you view original code. In reality, many sites don't deploy source maps to production for security reasons, bandwidth concerns, or simple oversight. When source maps are unavailable, you must work with minified code directly.
Legacy systems often lack source maps even if modern parts of your stack include them. That critical jQuery plugin from 2014? Minified without source maps. The ancient PHP template system generating inline JavaScript? Also no source maps. Being able to decipher minified code becomes essential for maintaining legacy systems.
Security research and analysis sometimes requires understanding minified code. When investigating whether a script is malicious, analyzing how a competitor's feature works, or understanding a potential security vulnerability, you're working with minified production code without benefit of source maps.
The Beautifier: Your First Line of Defense
Beautifying minified code represents the critical first step toward making it readable. While beautification cannot recover original variable names or comments, it can restore formatting—adding indentation, line breaks, and spacing that make code structure visible. This transformation from single-line incomprehensible blob to formatted code with recognizable structure is dramatic and immediately valuable.
Browser developer tools include built-in beautification. In Chrome DevTools, open minified JavaScript and click the "{}" button in the bottom-left corner of the Sources panel. This "Pretty Print" feature instantly beautifies the code, displaying it with proper indentation and line breaks. Firefox and Edge offer equivalent functionality. This built-in beautification requires zero setup and works immediately.
For example, this minified code:
function a(b){let c=0;b.forEach(d=>{c+=d.price*d.quantity});return c}
Becomes this after beautification:
function a(b) {
let c = 0;
b.forEach(d => {
c += d.price * d.quantity
});
return c
}
Still not ideal—variable names remain cryptic—but the structure is now visible. You can see this function takes parameter b, initializes c to 0, loops through items in b, and accumulates prices times quantities. Understanding what it does becomes possible despite the unhelpful variable names.
Online beautifiers like JS Beautifier, Prettier Playground, or Code Beautify provide alternatives to browser tools. Copy minified code, paste it into the online tool, and receive beautified output. These tools sometimes offer additional options like formatting preferences or handling of specific JavaScript features. However, for debugging immediate production issues, browser tools' built-in beautification is faster.
Decoding Single-Character Variable Names
Context clues help decipher what cryptically named variables represent. Look at how variables are used throughout a function:
function b(c) {
return c.map(d => ({
n: d.name,
p: d.price,
q: d.quantity,
t: d.price * d.quantity
}))
}
Even without knowing what b, c, and d represent, analyzing usage reveals meaning. Function b receives c (likely an array of items based on the .map() call), and for each item d, creates an object with properties n (name), p (price), q (quantity), and t (total—price times quantity). You can infer this function transforms an array of items into a summary format, even though every variable is a single character.
Type inference helps tremendously. When you see c.map(), you know c is an array. When you see d.name, you know d is an object with a name property. Modern JavaScript's array methods, object property access, and other operations provide hints about types even when variable names are obscure.
Consistent patterns in minified code mean minifiers typically use sequential variable names. The first variable becomes a, the second b, and so forth. Within a function, parameters are a, b, c while local variables might be d, e, f. This consistency helps—once you identify what a represents, subsequent references to a have the same meaning.
Leveraging Browser Developer Tools
Breakpoints let you pause execution and inspect variable values. Even with single-character names, seeing that a equals ['item1', 'item2', 'item3'] or b equals 1234.56 clarifies meaning. Click line numbers in DevTools Sources panel to set breakpoints, then refresh the page or trigger the relevant code path. When execution pauses, examine the Call Stack, Scope, and Watch panels to understand program state.
Step debugging walks through code line by line. Use Step Over (F10), Step Into (F11), and Step Out (Shift+F11) to control execution flow. Watching how variables change as you step through code clarifies logic even when variable names are meaningless. You can literally watch c start at 0 then increase as the loop accumulates values, making the accumulation pattern obvious.
Conditional breakpoints pause only when specific conditions occur. Right-click a line number and select "Add conditional breakpoint" to create breakpoints that activate only when an expression evaluates true. For debugging errors occurring only with specific data, conditional breakpoints save time by avoiding manual stepping through irrelevant iterations.
Watch expressions let you track specific values throughout execution. Add expressions to the Watch panel to monitor how they change as code executes. For example, watch items.length to see how an array's size changes, or total.toFixed(2) to format a running total for readability.
Console logging through injection provides insights when you cannot modify source code directly. Use DevTools console to redefine functions with added logging:
const original = window.someMinifiedFunction;
window.someMinifiedFunction = function(...args) {
console.log('Called with:', args);
const result = original.apply(this, args);
console.log('Returned:', result);
return result;
};
This wrapper logs inputs and outputs, clarifying what the minified function does without needing to understand its internals completely.
Understanding Minified Control Flow
Ternary operators replace simple if/else statements in minified code. Where original code might have:
if (user.isAuthenticated) {
showDashboard();
} else {
showLoginForm();
}
Minified code uses:
user.isAuthenticated?showDashboard():showLoginForm()
Recognizing ternary patterns lets you mentally expand them back to if/else structures for easier comprehension.
Short-circuit evaluation for side effects appears frequently. Original code like:
if (cache) {
return cache;
}
fetchData();
Becomes:
cache||fetchData()
The || operator evaluates the right side only if the left is falsy. Understanding this pattern helps decode conditional logic.
Comma operators combine statements. Instead of:
x++;
y++;
return z;
Minified code uses:
return x++,y++,z
The comma operator evaluates expressions left to right, returning the last value. Recognizing comma operators helps parse these combined statements.
Source Maps: When Available, Always Use Them
Source maps fundamentally change debugging experience by mapping minified code back to original source. When source maps exist, browser DevTools automatically load and use them, displaying original code with real variable names and comments. This feature transforms debugging from archaeological excavation to straightforward investigation.
Checking for source maps is simple—look at the last line of minified JavaScript files. If you see:
//# sourceMappingURL=bundle.js.map
A source map is available. Browsers automatically fetch and use this map, showing you original code in DevTools even though minified code is running.
Manually loading source maps works when auto-loading fails. In Chrome DevTools, right-click in the Sources panel and select "Add source map." Provide the source map URL and DevTools will load it. This manual process helps when source maps are served from different domains or when automatic loading encounters issues.
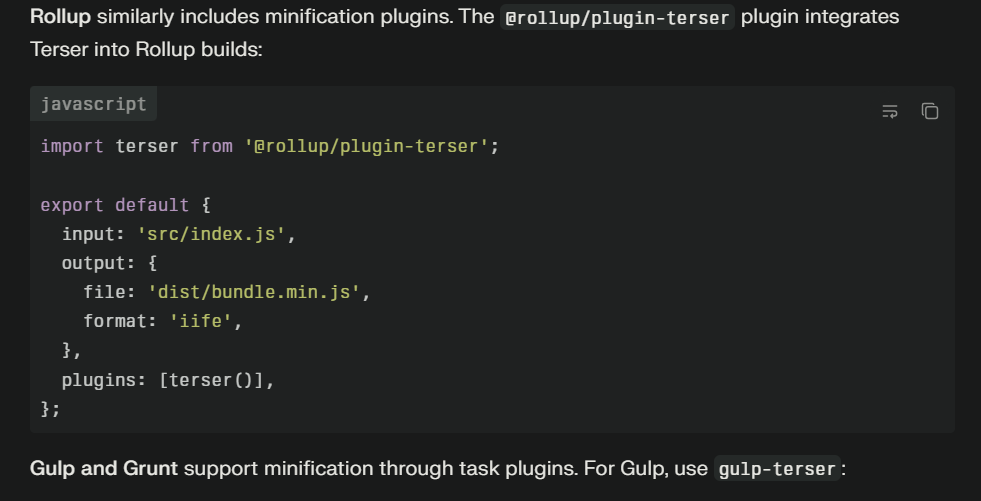
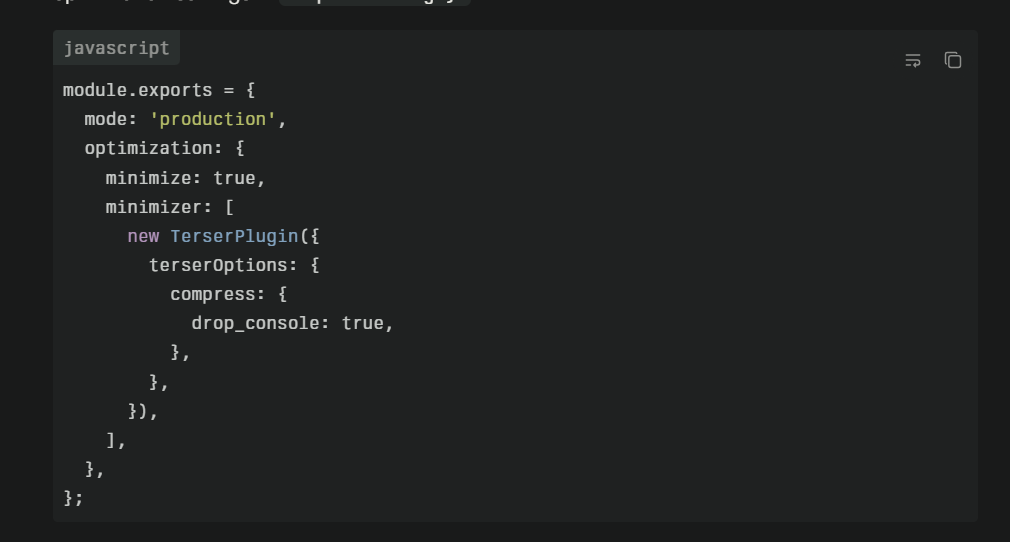
Generating source maps for debugging becomes necessary when dealing with third-party code lacking maps. If you have access to original source code, generate source maps yourself using appropriate build tools. Webpack, Rollup, Parcel, and other bundlers include source map generation. While this requires setup, having source maps for frequently debugged third-party code pays dividends.
Reverse Engineering Patterns
Common algorithm patterns appear even in minified code. A loop that accumulates a value is recognizable as a reduce operation. Nested loops often indicate matrix operations or combination generation. Recursive calls signal tree traversal or divide-and-conquer algorithms. Recognizing these patterns helps understand code purpose even when implementation details are obscure.
Framework conventions provide hints when debugging minified framework code. React components have recognizable patterns even when minified. Vue.js templates follow predictable structures. Angular code shows distinct patterns around dependency injection. Familiarity with framework conventions helps recognize what minified code is doing.
Business logic inference from code structure guides debugging. E-commerce sites have shopping cart operations, user authentication, payment processing. Even in minified code, operations that validate credit cards, calculate taxes, or apply coupon codes show recognizable patterns. Understanding the domain helps decode the code.
Building Your Minified Code Vocabulary
Practice regularly with intentionally minified code. Take simple functions from your own projects, minify them, then practice reading the minified output. This deliberate practice builds pattern recognition and comfort with minified code structures. Start with simple examples and gradually increase complexity.
Study open-source minified libraries. Download minified versions of popular libraries like jQuery, Lodash, or Moment.js. Try to understand what various sections do by reading the beautified-but-still-minified code. Check your understanding against the unminified source code. This practice develops skills that transfer directly to debugging production issues.
Keep references handy. Maintain a cheat sheet of common minification patterns—how ternary operators work, what short-circuit evaluation looks like, how comma operators combine statements. Quick reference accelerates decoding when under pressure during production incidents.
When to Give Up and Find Another Way
Extreme obfuscation goes beyond minification to deliberately obscure code. When encountering intentionally obfuscated code with encoded strings, complex eval statements, and deliberately confusing logic, the effort to understand it may exceed the benefit. Sometimes rebuilding functionality from scratch is faster than reverse-engineering heavily obfuscated code.
Critical production incidents sometimes require bypassing rather than understanding problematic code. If a third-party script is causing issues and you cannot quickly debug it, disabling or replacing it might be faster than understanding why it fails. Fix the immediate issue, then investigate root cause later when time pressure is less severe.
Alternative approaches like network monitoring, server-side logging, or user session replays sometimes provide better debugging information than code reading. If decoding minified code isn't yielding insights, try different debugging approaches that might more directly reveal the issue.
Reading minified code is a learnable skill that dramatically expands your debugging capabilities. While it's never as comfortable as reading well-formatted source code with descriptive names, it's entirely possible with the right tools and techniques. Practice these skills now, before 2 AM production emergencies force you to learn under pressure
_68fdda5eb9f9b.png)
